This pendulum animation provides a simple way for you to perform the popular pendulum activity on the computer. The aim of this activity is to find out which of the following 3 variables affect the period of a pendulum: mass of the bob, length of the string and frictional force.
The period is the time for one complete oscillation.
Complete this activity using real equipment.
Virtual Simulation
Use the simulation below. Spend about five minutes working with the simulation and locating the sliders to control the mass of the bob, the length of the string and the friction.
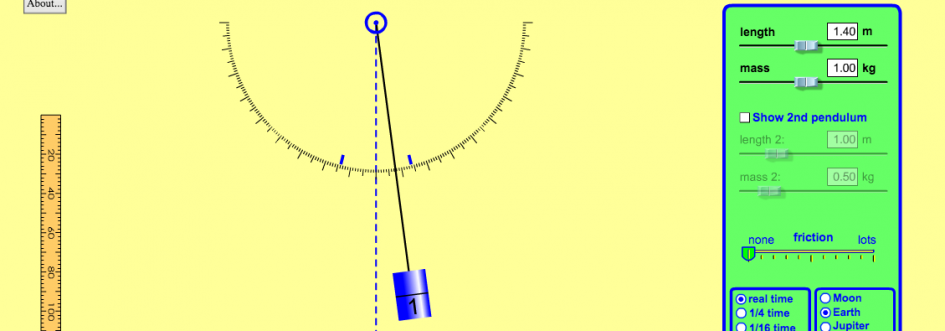
Pendulum Simulation
This sim can also be found here http://phet.colorado.edu/en/simulation/pendulum-lab.
Check the box that has the label photogate timer. The photogate timer will easily measure the period of the pendulum because it has a high degree of accuracy.
Experiment 1 – Investigating the effect of varying masses on the period of a pendulum
- For this experiment keep the length of the string at 2 m and set friction to none.
- Click the blue mass and drag it to the side until it is at an angle of 15 degrees. Release the mouse to allow the mass to fall.
- Click start on the photogate timer and record the period in the table below.
- Repeat this for all the masses in the table.
| Mass / kg | 0.25 | 0.50 | 1.00 | 1.50 | 2.00 |
| Period / s |
Experiment 2 – Investigating the effect of varying lengths on the period of a pendulum
- Set the length to 0.50 m
- Set the mass to 1 kg
- Uncheck ‘Show 2nd Pendulum’
- Set friction to none.
- Select real time and set the planet to Earth
- Check the box that has the label Photogate timer
- Click the blue mass and drag it to the side until it is at an angle of 15 degrees. Release the mouse to allow the mass to fall.
- Click start on the photogate timer and record the period correct to 2 decimal places in the table below.
- Repeat this for all the lengths in the table. Do not change the mass while you are repeating the experiment. Ensure to only change the length.
| length / m | 0.50 | 0.60 | 0.70 | 0.80 | 0.90 | 1.00 | 1.20 | 1.40 | 1.60 | 1.80 | 2.00 |
| Period / s | 1.42 | 1.56 |
- Plot a graph of T (y-axis) vs l (x-axis).
- Now plot a graph of T2 vs l.
- Compare the general trend of the points
Experiment 3 – Investigating the effect of varying amounts of friction on the period of a pendulum
- For this experiment keep the length of the string at 2 m and keep the mass at 1 kg.
- Click the blue mass and drag it to the side until it is at an angle of 15 degrees. Release the mouse to allow the mass to fall.
- Click start on the photogate timer and record the period correct to 2 decimal places in the table below.
- Try it for the three values of friction in the table below
| Friction | None | Mid-point | Lots |
| Period / s |
Which variable affects the period of the pendulum?
[activecampaign form=1]
Leave a Reply